|
| HOME > Product Information > Automatic-meter-reading control syste > Portable antenna data visualization software | |||||||||||||||||
 |
|||||||||||||||||
| Analysis system | |||||||||||||||||
| A scientific-experiments device design and manufacture | |||||||||||||||||
| Automatic control and counting system |
|||||||||||||||||
| >>Baking heater control power supply | |||||||||||||||||
| >>Micro syringe pump | |||||||||||||||||
| >>Gate valve opening-and-closing time counting system | |||||||||||||||||
| >>Portable antenna data visualization software | |||||||||||||||||
| Microchamber | |||||||||||||||||
| Product outline |
|
||||||||||||||||
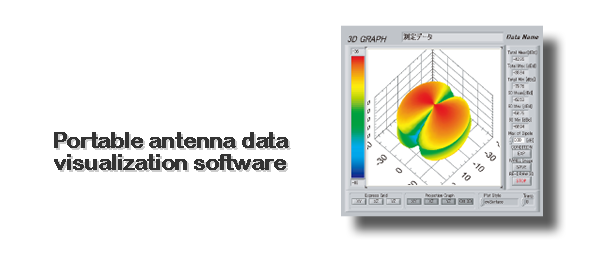
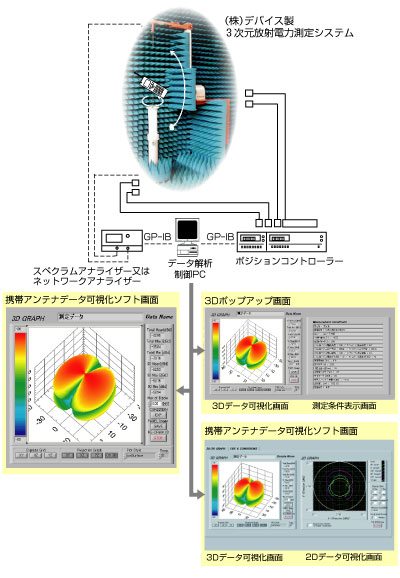
(3D) and a two-dimmensional graph (2D) three-dimensional it turns and this software visualizes the examination measurement data at the time of development, in order to evaluate the antenna performance of mobile computing devices made highly efficient. |
|||||||||||||||||
| Feature and Function | |||||||||||||||||
| ・Expansion, reduction, and rotation are possible for a 3D graph free, and it can express the color on the surface of a 3D graph arbitrarily with measured value intensity. ・Expansion reduction of a graph is possible for 2D graph by to show graphically measured intensity of 90 zenith angle and angle-of-direction 0(180)degree and 90(270)degrees, and setting up a scale arbitrarily. ・It has functions, such as carrying out the maximum of all the measurement data and 90 zenith angle data , the minimum, and average value at a table example, and indicating the 3D graph by selection at a pop-up window. |
|||||||||||||||||
 |
|||||||||||||||||
| Specifications and Performance | Use field | ||||||||||||||||
(1) 3D graph |
 |
||||||||||||||||
| 3D graph mode | The surface, a line(wire),a point, a line/point, etc. |
||||||||||||||||
| 3D graph transparation | 0 to 100% | ||||||||||||||||
| 3D graph operation | Expansion, reduction, rotation | ||||||||||||||||
| Projection | A 3rd page (XY,XZ,YZ)projection and 3D graph display off | ||||||||||||||||
| Grid | Display on/off of a 3rd page (XY,XZ,YZ)grid | ||||||||||||||||
(2) 2D graph |
|||||||||||||||||
| 2D graph | Three graphs(90 zenith angle and angle-of-direction 0(180)degree, 90(270)degree) |
||||||||||||||||
| 2D graph operation | Rectangular scale change, the number change of circle scales | ||||||||||||||||
(3) 3D pop-up |
|||||||||||||||||
| 3D graph function | It is the same as (1) 3D graph. |
||||||||||||||||
| Measurement conditions | Measurement conditions selected on the 2nd screen are displayed. | ||||||||||||||||
| <<BACK | |||||||||||||||||